Explanation of Charts
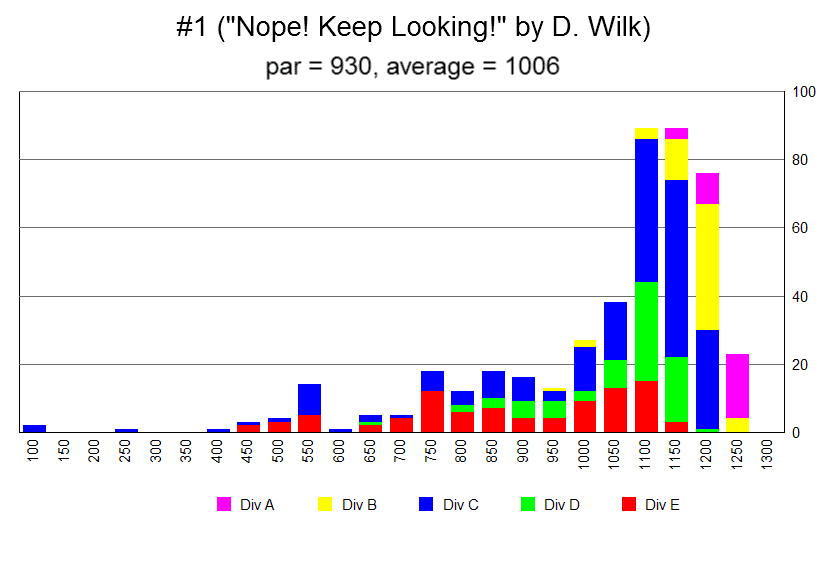
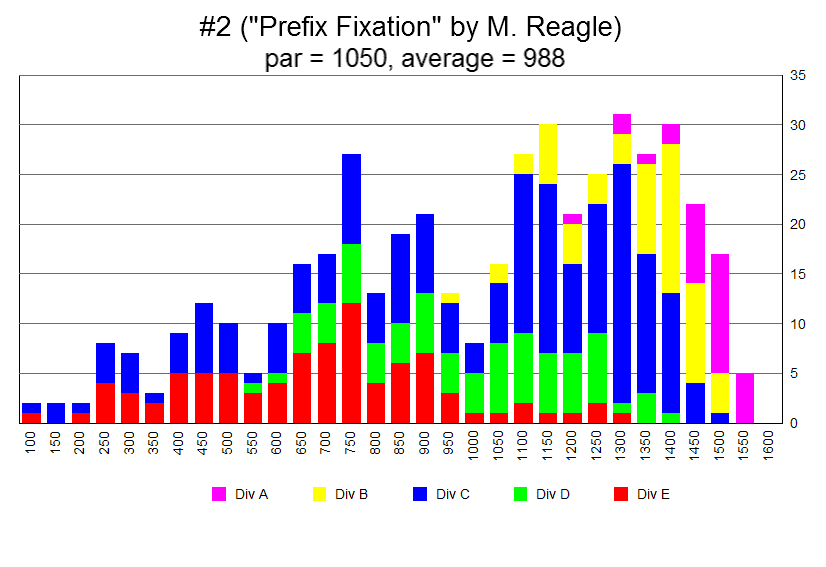
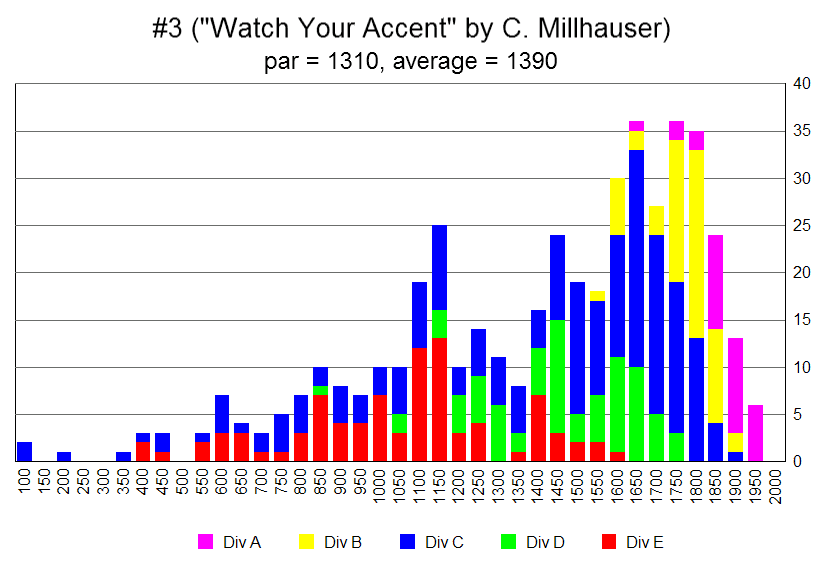
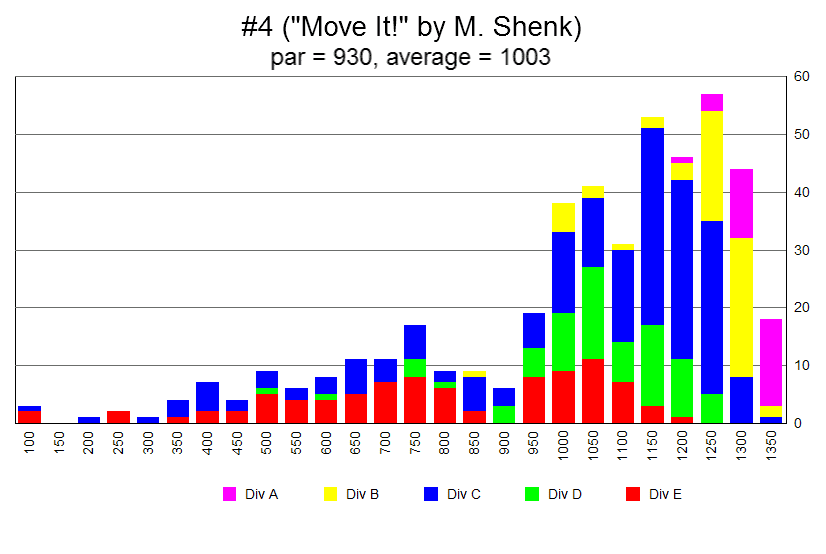
Each contestant's score on each puzzle was based on the number of correct words, plus a bonus if the puzzle was solved with no mistakes, plus another bonus for speedy solving.
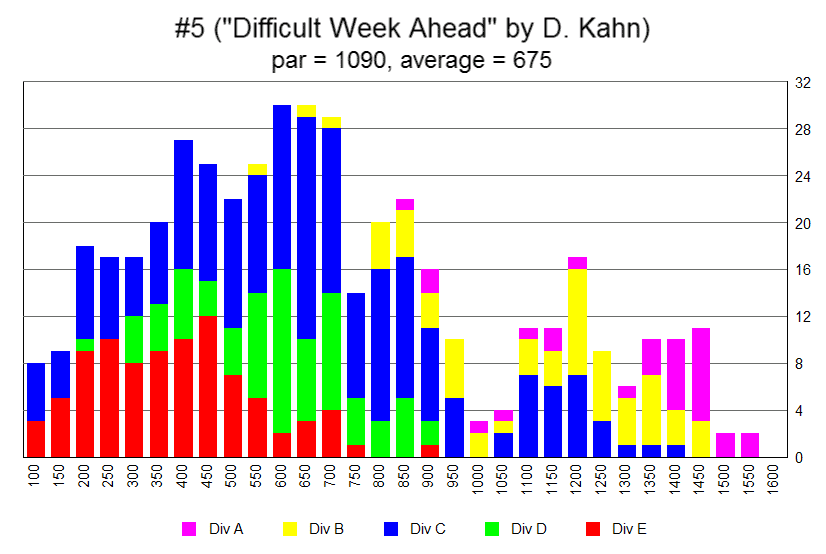
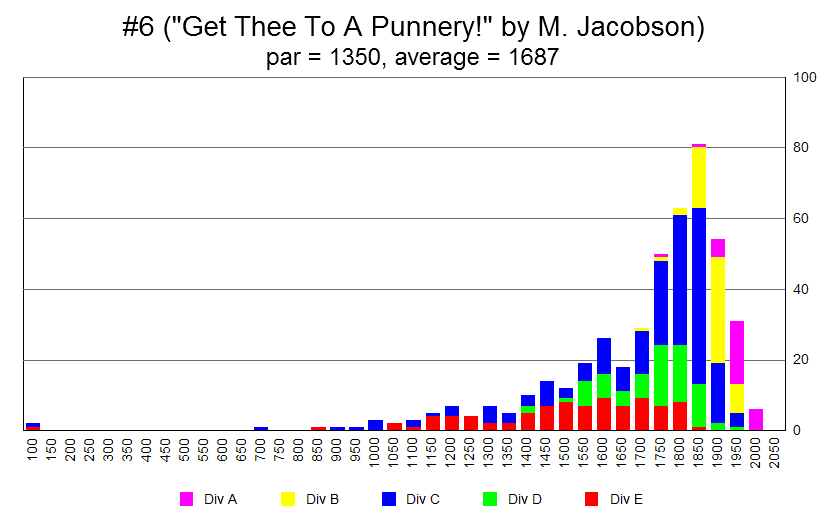
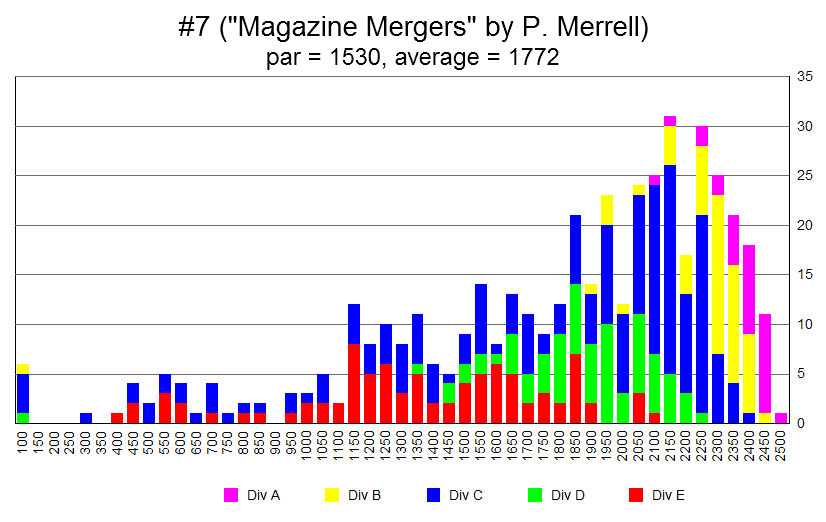
Below is one chart for each of the 7 puzzles at the 2007 Tournament.
Each chart shows:
- The graph shows how many entrants got each score.
- The scores are along the bottom, and the number achieving the score is on the right side.
- The colors indicate skill division (A, B, and others). The top experts are in the "A" division.
- For example, on puzzle #1, the right-most bar scored the highest. Nearly all of those were in the "A" division.
Thanks to Mel Rosen for preparing these analyses!
